

Ever launched a campaign only to find your tags weren’t firing correctly? Few things are more frustrating than missing valuable data because of tracking errors. That’s where learning how to debug Google Tag Manager becomes essential.
When GTM isn’t working as expected, even small issues can lead to inaccurate reports and poor marketing insights. The good news is that Chrome provides one of the most reliable environments for troubleshooting. With the right extensions, you can quickly detect errors, validate your setup, and ensure every tag works as intended.
In this guide, we’ll walk through proven techniques to debug Google Tag Manager effectively. You’ll learn how to identify common problems, resolve configuration issues, and optimize your container performance using powerful Chrome debugging tools.
Short Intro
Debug Google Tag Manager effectively by using Chrome’s Preview Mode, Developer Tools Network tab, and specialized extensions like Google Tag Assistant. Clear your browser cache, disable ad blockers, and check the JavaScript console for error messages. Verify your GTM container code implementation and examine data layers to identify tracking issues quickly.
Understanding Google Tag Manager (GTM)
Google Tag Manager serves as a centralized platform for managing tracking codes without requiring direct website modifications. Debugging GTM means checking how your tags run, when triggers respond, and how data passes through your setup.
The debugging process involves examining three core components: tags (the tracking codes), triggers (conditions that fire tags), and variables (data sources for your tags). Understanding these relationships helps you pinpoint exactly where tracking breaks down.
Most GTM issues stem from incorrect trigger conditions, missing data layer events, or conflicting scripts. Chrome provides multiple debugging interfaces to examine each component systematically.
How Should You Prepare Chrome for Debugging?
Start every debugging session by clearing your browser cache and cookies. Cached GTM container files often cause tracking discrepancies that persist even after corrections are made.
Go to Chrome Settings, open Privacy and Security, then choose Clear Browsing Data. Set the time range to All time and tick both Cookies and other site data, along with Cached images and files. This ensures you’re testing the most recent version of your container code.
I recommend using incognito mode for debugging sessions at your local workspace. This provides a clean browser environment without interference from stored data or browser extensions.
Disabling Ad Blockers and Suspicious Extensions
Ad blockers and privacy-focused browser extensions frequently block tracking scripts, creating false debugging results. Disable these extensions before beginning your troubleshooting process. Common extensions that interfere with GTM include:
- Adblock Plus and uBlock Origin
- Privacy Badger and Ghostery
- VPN extensions with tracking protection
- Browser security extensions
Test your tracking with all extensions disabled first. If tags fire correctly, re-enable extensions one by one to identify the specific interference source.
Enabling Third-Party Cookies
Google Analytics and other tracking platforms require third-party cookies to function properly. Chrome’s increasing privacy restrictions can block these cookies by default.
Open Chrome Settings, head to Privacy and Security, then select Third-party Cookies. Temporarily allow third-party cookies during debugging sessions to eliminate this variable from your troubleshooting process.
Using GTM Preview Mode
Preview Mode provides real-time visibility into tag firing behavior. Access this debug interface through your GTM workspace by clicking the “Preview” button in the top-right corner.
When activated, Preview Mode creates a debugging session that persists across browser tabs. Navigate to your website, and you’ll see the GTM debug interface at the bottom of your page showing fired tags, blocked tags, and data layer events.
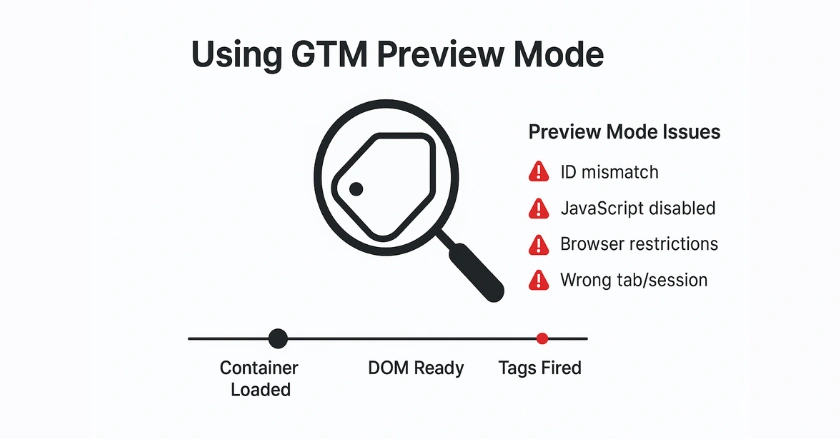
The Event Timeline shows tag activity in order, beginning with Container Loaded and followed by DOM Ready events. Each event shows which tags fired and provides access to detailed event data through the event Data tab.
Identifying Common Preview Mode Issues
Preview mode disconnect occurs when the debugging session expires or browser settings interfere with the preview mode cookie. If you don’t see the debug interface, verify that:
- Your GTM container ID matches your website implementation
- JavaScript is enabled in your browser settings
- No browser restrictions block the debugging connection
- You’re accessing the site through the same browser tab where Preview Mode was activated
Mode issues often result from testing in Private Browsing Mode or switching between different browser versions during debugging sessions.
Can You Use Chrome Dev Tools for GTM?
Leveraging the Network Tab
Chrome Developer Tools provides granular insight into GTM network requests and potential tracking failures. Hit F12 to launch Developer Tools, then switch to the Network tab. Filter network requests using “gtm” or “analytics” to focus on relevant tracking calls. Failed requests appear in red, indicating blocked tracking or server-side issues affecting your implementation. Pay attention to:
- GTM container loading requests (gtm.js)
- Google Analytics 4 measurement requests
- Custom pixel requests from third-party platforms
- Error response codes (404, 403, 500)
Inspecting Event Listeners
The Console tab reveals JavaScript errors that prevent proper tag firing. GTM-related errors often appear when data layers aren’t properly initialized or when conflicting scripts interfere with tracking. Common console errors include:
- “dataLayer is not defined” errors
- JavaScript libraries conflicts
- Tracking setup initialization failures
- Hidden errors from misconfigured triggers
Use the Console tab to execute dataLayer commands manually, testing variable values and event firing without waiting for user interactions.
What Are the Best Chrome Extensions for Debugging?
Google Tag Assistant
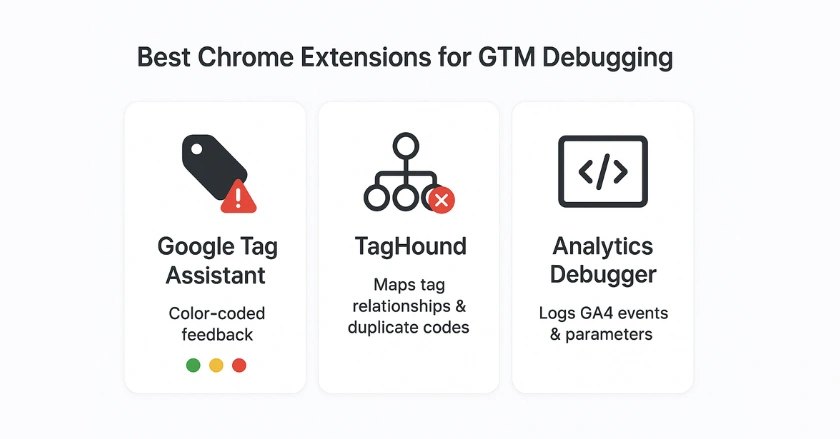
Google Tag Assistant is the official tool used to debug Google’s marketing platform. This Tag Assistant Chrome Extension automatically detects Google Analytics, Google Tag Manager, and conversion tracking implementation issues. The extension provides color-coded feedback:
- Green indicates proper implementation
- Yellow suggests minor optimization opportunities
- Red identifies critical tracking problems requiring immediate attention
Tag Assistant Companion mode offers enhanced debugging capabilities, providing detailed insights into tag configuration and performance optimization recommendations.
TagHound
TagHound specializes in advanced debugging for complex GTM configurations. This debugging tool provides visual representations of tag relationships and data flow patterns.
The extension excels at identifying duplicate tracking codes and conflicting trigger conditions that cause tracking inconsistencies. It’s particularly valuable for debugging SPA tracking implementations.
Analytics Debugger
Google Analytics Debugger enables verbose logging for Google Analytics requests, providing detailed information about tracking parameters and user data transmission. When activated, this extension logs all GA4 events, custom dimensions, and event parameters to the JavaScript console, simplifying debugging for Google Analytics implementations.
Checking GTM Container Performance
Verifying GTM ID Implementation
Container code verification ensures your website loads the correct GTM container. Inspect your page source and locate the GTM snippet in your HTML head section. Verify that:
- The GTM ID matches your container identifier
- No duplicate tracking codes exist on the same page
- The container loads before other tracking scripts
- No JavaScript errors prevent container initialization
Common implementation errors include using draft mode container IDs in production environments or installing multiple GTM containers that conflict with each other.
Ensuring Public Access and No Redirects
Network blocks and server-side restrictions can prevent GTM container loading. Test container accessibility by directly accessing your container URL in Chrome.
A properly configured container returns JavaScript code. Error responses indicate server-side issues, DNS problems, or CDN configuration errors affecting tracking performance.
Advanced Troubleshooting Techniques
Investigating iFrame Conflicts
Cross-domain tracking and embedded content create complex debugging scenarios. When GTM containers load within iFrames, tracking data may not propagate correctly to parent pages.
Test tracking on AMP pages and embedded content separately from your primary website. Each iframe maintains its data layer context, requiring specialized tracking implementation approaches.
Diagnosing Data Layer Issues
Data Layer Variable problems often stem from timing issues where tags attempt to access data before the layer initialization code executes. Use Chrome’s Network requests to verify data availability.
Debug triggers by examining actual events in Preview Mode. Incorrect trigger conditions cause tags to fire at inappropriate times or fail to fire entirely.
Compliance with GDPR and CCPA
Privacy regulations affect GTM debugging by requiring user consent before loading tracking scripts. Test your implementation with Google Consent Mode enabled to ensure compliance doesn’t break tracking.
Debug consent-dependent tracking by simulating different consent scenarios and verifying that tags fire appropriately based on user permissions.
Why Do Multiple GTM Installations Cause Issues?
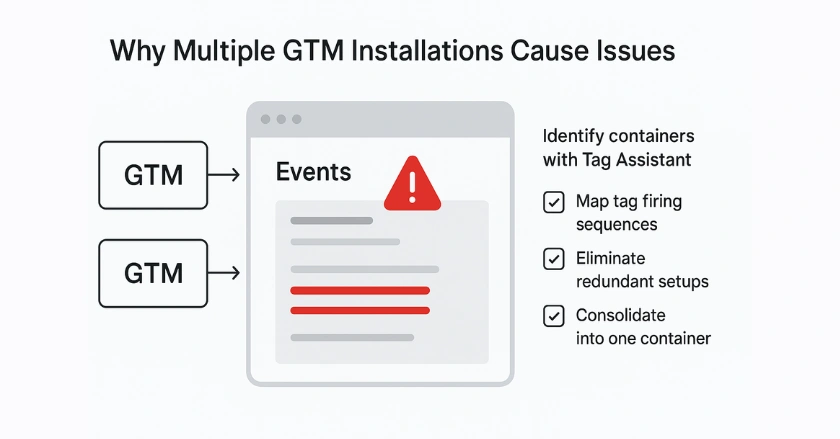
Multiple GTM containers on the same page create conflicts that manifest as duplicate events, incorrect attribution, and inflated metrics. This commonly occurs on e-commerce platforms like Shopify’s built-in Google Analytics tracking, combined with custom GTM implementations. Debugging multiple installations requires:
- Identifying all GTM containers using Tag Assistant
- Mapping tag firing sequences across containers
- Eliminating redundant tracking implementations
- Consolidating tracking logic into a single container when possible
Real-time tracking discrepancies often trace back to competing container installations rather than individual tag configuration errors.
Pro Tips for Effective GTM Debugging
Start debugging sessions with a systematic approach. Document your current tracking behavior before making changes, creating a baseline for comparison.
Use correct trigger types for your specific tracking needs. Page view triggers work differently from click triggers, and understanding these distinctions prevents misconfigured triggers.
Test tracking in multiple browser settings to identify browser-specific issues. What works in Chrome may fail in privacy-focused browsers with stricter security policies.
Always verify actual user experience by testing outside of debug mode. Preview Mode doesn’t perfectly replicate real-world user interactions and network conditions.
Final Thoughts
Mastering GTM debugging in Chrome requires patience and systematic troubleshooting approaches. The techniques outlined here have helped me resolve countless tracking implementations, from simple tag-firing issues to complex data layer problems.
Remember that debugging is an iterative process. Start with basic verification steps like clearing the cache and disabling extensions before moving to advanced troubleshooting techniques.
Your debugging skills will improve with practice. Each troubleshooting session teaches you more about how GTM interacts with different website technologies and browser environments.
FAQs
1. How do I debug Google Tag Manager in Chrome?
You can debug Google Tag Manager in Chrome by enabling Preview Mode from your GTM workspace. Once activated, the debug console shows fired tags, blocked tags, and data layer events in real time. For deeper troubleshooting, use Chrome DevTools (Network & Console tabs) or the official Tag Assistant extension.
2. Why is my Google Tag Manager debug mode not working?
Google Tag Manager debug mode may fail if your container ID is incorrect, JavaScript is disabled, or browser restrictions block the preview cookie. To fix this, clear the cache, disable ad blockers, and ensure you open the same site in the same Chrome tab where Preview Mode was activated.
3. What is the best Chrome extension to debug Google Tag Manager?
The best Chrome extension for debugging GTM is Google Tag Assistant, which highlights implementation errors with color-coded signals. Other useful tools include TagHound for mapping tag relationships and Analytics Debugger for checking GA4 event logs in the console.
4. Can Google Tag Manager help with SEO?
Indirectly, yes. Google Tag Manager doesn’t boost rankings itself, but it simplifies adding scripts like Google Analytics, schema markup, or tracking pixels without developer help. Proper debugging ensures scripts load correctly, which improves site speed, data accuracy, and overall SEO performance.
5. How does Google Tag Manager Preview Mode work technically?
When you enable GTM Preview Mode, Chrome sets a debug cookie that connects your browser session with the GTM container. The debug panel then tracks events like Container Loaded and DOM Ready, showing which tags fire and why. This helps identify misfiring triggers and missing data layer events.