

Google Analytics can feel overwhelming, especially when you’re starting. Are you a student exploring digital marketing or a new marketer trying to grasp website data? You’ve likely heard of Google Analytics 4 (GA4) and wondered why it’s so popular. Think of this as a GA4 for dummies guide designed to simplify everything for beginners.
This guide breaks down GA4 into bite-sized, easy-to-understand pieces. By the end, you’ll know how to set up GA4, navigate its dashboard, and pull useful insights from your data. You don’t need a technical background.
Short Summary
Google Analytics 4 is Google’s latest analytics tool. It tracks user behavior on websites and apps with an event-based model. GA4 differs from Universal Analytics. It emphasizes the entire customer journey and uses machine learning for predictive insights. This guide helps you with everything from setup to key reports. It makes GA4 easy for beginners who want to measure their digital marketing efforts well.
What Makes GA4 Different from Analytics?
Google Analytics 4 represents a complete reimagining of how we track and understand user behavior online. Think of it as your digital detective. It tracks visitors on your website, noting every click, scroll, and interaction.
GA4 is important for students and new marketers. It’s now the standard for measuring website performance. GA4 helps you understand user engagement. Whether you run a blog, manage social media, or analyze marketing campaigns, this data lets you make smart choices.
The platform uses machine learning to predict future user actions. This helps you see not just what happened, but also what might happen next with your audience.
Moving Beyond Universal Analytics (UA)
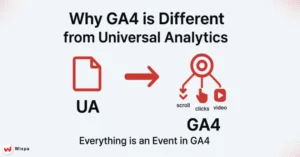
Universal Analytics stopped collecting data in July 2023. Now, everyone must switch to GA4 if they want to keep analyzing their web data. The old system focused heavily on page views and sessions, which worked well when websites were simpler.
GA4 takes a different approach by tracking everything as events. When someone visits your site, scrolls down a page, or clicks a button, each action becomes an event that GA4 records and analyzes.
This change allows for better tracking on websites and mobile apps. You’ll get a full view of how users engage with your brand at various touchpoints.
Who is this guide for?
This guide is for students learning digital marketing and new marketers. It offers practical GA4 knowledge without the technical jargon. If you’ve been searching for a simple GA4 for dummies approach, you’re in the right place. Feeling confused by analytics dashboards? Terms like “data streams” and “conversion events” can be tricky. But don’t worry, we’ll make them easy to understand.
We’ll use real-world examples and simple analogies to make complex concepts clear. No previous analytics experience is required, just curiosity about understanding your website’s performance.
No matter if you run a local business site or a personal blog, these basics will help you confidently use GA4’s interface.
How does GA4’s event-based model work?
Traditional web analytics focused on page views, counting how many times people loaded your web pages. GA4’s event-based model treats every user interaction as an event, creating a much richer data picture. When someone visits your website, GA4 automatically tracks events like:
- Page views (still tracked, but as events)
- Scroll depth (how far down they read).
- File downloads
- Video plays
- Form submissions
This approach captures the full story of user behavior, not the pages they visited. You know they watched a video, downloaded a guide, and spent time reading your content. This is better than knowing they viewed five pages.
Tracking the Entire Customer Journey
Customer journey tracking in GA4 follows individuals across many sessions and devices. If someone finds your website on their phone at lunch, then comes back on their laptop to buy something at home, GA4 links these actions as one journey.
This user-centric approach helps you understand which marketing efforts actually drive results. Users often visit your site three times before converting. Also, mobile visitors usually prefer different content than desktop users.
The platform uses Google’s machine learning. It fills gaps that traditional tracking misses. This gives you better insights into user behavior. You’ll get more accurate data for content marketing and customer lifecycle analysis.
How GA4 Tracks User Behavior
Think of GA4 as keeping a detailed digital diary for each website visitor. This diary goes beyond saying “John visited the store.” John walked in the front door. He looked at the shoes for 3 minutes. Then, he picked up a red sneaker and checked the price. Finally, he left without buying anything.
This detailed tracking helps you understand user interaction patterns. Visitors who watch your product videos are 50% more likely to make purchases. Or users who read your blog posts first become more loyal customers over time.
Each event in GA4 shows how users engage with your website. This helps you understand their experiences and what drives their actions.
What steps do you need for GA4 setup?
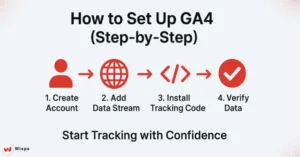
Creating Your Google Analytics Account and GA4 Property
To set up your Analytics account, go to analytics.google.com. Sign in using your Google account. If you already use Google Ads or Google Search Console, you can use the same login credentials.
The setup process involves creating a new property specifically for GA4. Think of properties like separate boxes for websites or apps. You could have one box for your main website and another for your mobile app.
During setup, you’ll choose your industry category and business size, which helps GA4 customize its interface and recommendations for your specific needs.
Setting Up Your First Data Stream
Data streams represent the sources sending information to your GA4 property. For most beginners, you’ll start with a web data stream for your website, though GA4 also supports iOS and Android app streams for comprehensive cross-platform tracking.
When creating a web data stream, you’ll enter your website URL and name the stream something recognizable. GA4 generates enhanced measurement events automatically, tracking common interactions like scrolling, outbound clicks, and site search without additional setup.
This automatic event tracking gives you valuable user behavior data right from day one, making GA4 more useful than Universal Analytics for new users.
Installing the GA4 tracking code on your site
Installing your tracking code depends on your website platform. WordPress users can add GA4 with minimal effort by using plugins like MonsterInsights or Site Kit by Google. Other platforms may need you to add code directly to your site’s header.
The tracking code includes a Global Site Tag (gtag). You need to paste it into the HTML of each page. Or, you can use Google Tag Manager for more advanced setups. Many website builders now include Google Analytics. This makes the process easier.
For e-commerce sites, extra setup improves tracking. It captures details like product views, cart additions, and purchases. This information helps inform your marketing decisions.
Verifying Your GA4 Installation
After installing your tracking code, use GA4’s real-time report to verify data collection. Check your website in a different browser or incognito window. Then, see if your visit shows up in the real-time report after a few minutes.
The DebugView in GA4 shows detailed event info for testing. It clearly shows which events trigger when you interact with your site. This tool helps identify tracking issues before they affect your data quality. Common verification steps include:
- Ensure that the system registers page views in real time.
- Testing form submissions and button clicks.
- Confirm that your conversion events trigger correctly.
- Ensuring that mobile and desktop tracking both work properly
How do you navigate GA4’s interface?
The GA4 dashboard opens to your Home page. Here, you see key metrics like active users, new users, and engagement time. This overview offers fast insights into your website’s current performance. You won’t need to dig into detailed reports.
Your left sidebar contains the main navigation sections: Reports, Explore, Advertising, and Admin. Each section meets different needs. Some focus on basic reporting, while others support advanced analysis and account management.
The reporting interface highlights visual data with charts and graphs. This makes it easy to spot trends. GA4 offers clear insights, while Universal Analytics can feel cluttered with tables.
Understanding the Main Navigation
The Reports section features standard analytics reports. The system organizes them by user lifecycle: Acquisition, Engagement, Monetization, and Retention. Life cycle reports show how users find, engage with, and may become customers on your website.
Explore provides advanced tools for making custom reports. You can also dig deep into specific questions about your data. Think of it as your analytics playground, where you can experiment with different data combinations.
The Admin section handles account settings, user access, and integrations with other Google tools. New users usually focus on Reports at first. As they improve their analytics skills, they start exploring other sections.
Customizing Your Overview
GA4 allows extensive customization of your reporting interface to match your specific business goals. You can modify the Home dashboard to highlight metrics most relevant to your marketing efforts, whether that’s e-commerce revenue or blog engagement metrics.
Custom reporting becomes particularly valuable as you identify which data points matter most for your business decisions. You might focus on user retention rather than gaining new users. Or maybe video engagement metrics guide your content strategy.
The Library section stores your custom reports and explorations, making it easy to return to frequently used analyses. This personalization makes GA4 more efficient for your regular reporting needs.
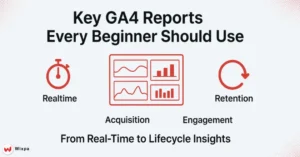
Which GA4 Reports Should Beginners Focus On?
See What’s Happening on Your Site Right Now
The real-time report displays what’s happening on your website now. It shows how many people are browsing, which pages they view, and what actions they take. Immediate feedback is very helpful when you launch marketing campaigns or publish new content.
Watch user engagement happen in real-time. You can see which blog posts attract readers and how visitors move through your site. For local businesses, the real-time report provides geographic data. This helps you see when and where your audience is most active.
This report is a quick health check for your website. If you’re running ads but have no real-time traffic, something needs attention right away.
Understanding Your Customer’s Journey from Start to Finish
Lifecycle reports in GA4 focus on four key stages:
- Acquisition: how users find you.
- Engagement: what they do on your site.
- Monetization: revenue generation.
- Retention: repeat visits.
This structure makes it easier to understand your complete customer journey.
The Acquisition report reveals which marketing channels generate the best traffic. Your social media may draw in many visitors. However, email marketing usually brings in users who stay longer and engage more with your content.
Engagement reports show what content connects with your audience. They use metrics like engagement time and user interaction patterns. This data guides content marketing decisions and website optimization efforts.
Who Are Your Users?
User reports give you insights about your audience. They include details like age ranges, gender, and interests, when available. This info helps you shape your content and marketing. It targets your real audience, not just guesses.
Technology reports reveal the devices, browsers, and operating systems your visitors use. This helps you make better choices for website design and functionality. If 70% of your traffic is from mobile devices, your site must perform well on smartphones.
Lifetime value metrics help you find your most valuable user groups. They show which visitors bring the most long-term benefit through repeat visits and conversions.
What Questions Can These Reports Answer for Your Business?
GA4 reports can answer practical business questions like:
- Which blog posts keep visitors on your site the longest?
- What percentage of your traffic comes from mobile vs. desktop?
- Which social media platforms send the most engaged users?
- How often do first-time visitors return to your site?
GA4 helps e-commerce businesses see buying patterns, popular products, and conversion funnels. It shows where potential customers drop off in the buying process.
Content creators can find out which topics get the most user engagement. They can also see which formats, like videos, articles, or infographics, work best for their audience.
How Do Events and Conversions Work?
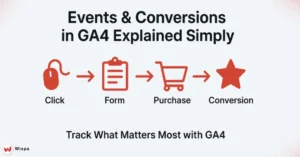
Demystifying Events
Events in GA4 capture every meaningful interaction users have with your website. Automated measurement enhances event tracking. This includes page views, scrolls, outbound clicks, and file downloads. It does this without needing any technical setup.
Custom events help you track key actions for your business. These include newsletter signups, video completions, and product demo requests. Each event has parameters that add context. They show which video was watched or which download was clicked.
Event tracking replaces the goals system from Universal Analytics. It provides more flexibility. Plus, it offers detailed insights into user behavior on your digital platforms.
Setting Up Conversions
Conversion events represent the most valuable actions users can take on your website. GA4 suggests conversions from your event data automatically. You can also choose important events to mark as conversions manually.
Common conversions include:
- Purchase completions for e-commerce sites.
- Contact form submissions for service businesses.
- Newsletter sign-ups for content sites
- Video completions for educational platforms.
Setting up conversions lets you see how well your marketing campaigns and website are performing. It tracks how many visitors complete the actions you want.
How does GA4 connect with other tools?
Google Ads
Linking Google Ads to GA4 gives you better insights into ad performance. You’ll see more than just clicks and impressions. You can see how ad traffic behaves on your website, which campaigns drive the most engaged users, and which ads lead to actual conversions.
This integration allows for smarter bidding strategies. It focuses on user engagement, not just clicks. You might discover that certain keywords bring visitors who spend more time on your site and are more likely to become customers.
Importing conversions from GA4 to Google Ads helps you spend wisely. It focuses on campaigns that deliver real business results, not just website traffic.
Google Search Console
Google Search Console integration reveals the search queries that drive organic traffic to your site. It also shows how that traffic acts once it arrives. This connection helps identify content gaps and optimization opportunities.
You can see which pages get the most search traffic. You can also find out what keywords people use to discover your content. Additionally, you can compare how search visitors engage with other traffic sources. This data proves invaluable for content marketing and SEO strategy development.
The combined data helps answer questions like: Do people who find you through search stay longer than social media visitors? Which search queries lead to the highest conversion rates?
Google Tag Manager (GTM)
Google Tag Manager makes it easy to handle many tracking codes. It also allows for advanced event tracking without needing to change your website code all the time. For growing businesses, GTM becomes essential for maintaining clean, organized analytics setups.
With GTM, you can track user actions like scroll depth, time on page, and button clicks. This detail offers clear insights into how users engage. These insights help make better decisions for website optimization.
Beginners can start with basic GA4. But learning GTM allows for advanced analytics. This can help you make data-driven marketing choices as your skills grow.
Pro Tips for GA4 Success
Getting the most from GA4 requires consistent attention to data quality and regular analysis of your reports. Even in a GA4 for dummies context, the key is to set aside time each week to review your metrics and look for trends that might inform business decisions.
Understand your unique user behavior patterns. Don’t just compare your metrics to industry averages. Your audience’s needs and preferences are more important than general benchmarks for optimization decisions.
Set up automated reports or alerts for key metrics. This helps you quickly spot when something needs attention or when a marketing campaign is doing really well.
Ready to Master Your GA4 Analytics?
Google Analytics 4 changes how we see user behavior. It emphasizes events and customer journeys instead of just page views. This approach gives better insights. It helps in making smart marketing choices and improving user experiences.
GA4 is better at predicting and taking action than earlier versions. This is due to its event-based model and use of machine learning. Once you’re familiar with basic reports and navigation, you’ll find smarter ways to analyze data and boost business growth.
Remember that analytics mastery develops through consistent practice and curiosity about your data. Begin with the basic reports in this guide. Then, as you gain confidence and need more analysis, explore advanced features.
Your journey with GA4 starts with the basics. But the real value lies in analyzing your data regularly. Use those insights to boost your website’s performance and enhance user experience.
FAQ
1. What is GA4 and how does it work?
GA4 tracks users across devices with event-based data, giving clearer insights for beginners following a GA4 for dummies approach.
2. Is GA4 easy to learn?
Yes, GA4 is easier than it looks; start with events and reports basics, and any GA4 for dummies guide makes the learning curve smoother.
3. Why is GA4 so complicated?
GA4 feels complex because of new event models, but a structured GA4 for dummies walkthrough simplifies setup and reporting.
4. What data does GA4 provide?
It delivers real-time user activity, engagement metrics, and cross-platform tracking, perfect for marketers using a GA4 for dummies plan.
5. How hard is it to learn GA4?
With free Google courses and a GA4 for dummies guide, most beginners can grasp key features in just a few focused learning sessions.